Better insights, better decisions
Microsoft Power BI
Collect, structure and visualize your company data Power BI
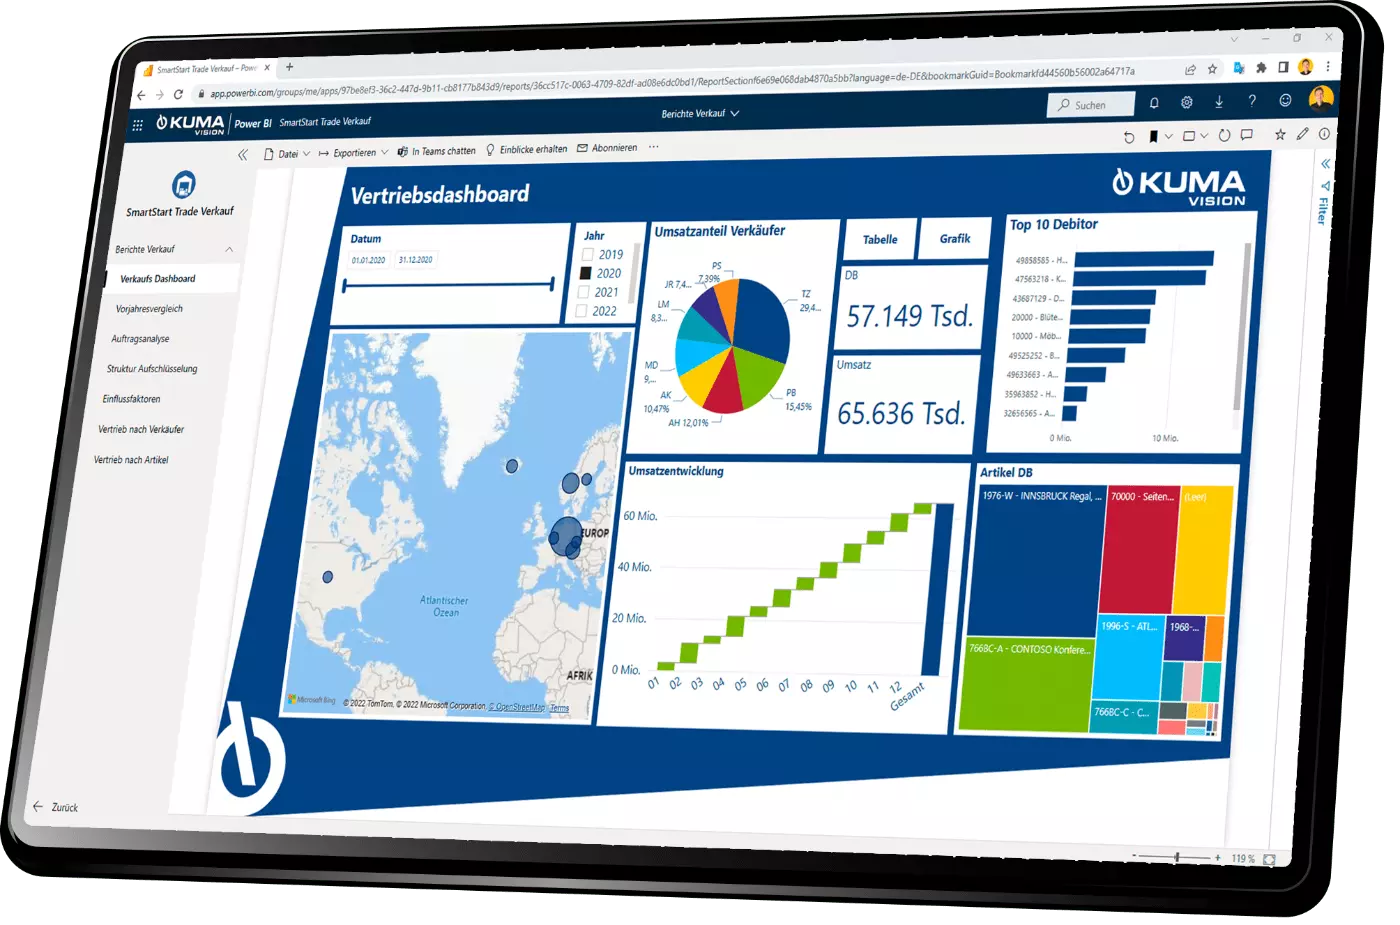
If you have a lot of data, you are far from informed. With the business intelligence solution Microsoft Power BI collect, structure, analyze and visualize your company data - from ERP, CRM and other data sources.
Microsoft Power BI is part of the Power Platform and therefore a low-code solution: You can quickly and easily create meaningful visualizations, clear dashboards and interactive reports yourself.
Meet with Power BI operational and strategic decisions based on reliable data. Recognize trends at an early stage and gain valuable competitive advantages through intelligent analyses.
- Make better decisions
- Create reports yourself
- Visualize KPI
- Recognize opportunities
- Minimize risks
- reduce costs
- improve collaboration
BI is that easy today!
For Power BI you do not need any programming knowledge. The self-service approach enables you to easily create reports, evaluations and dashboards and share them with your team.
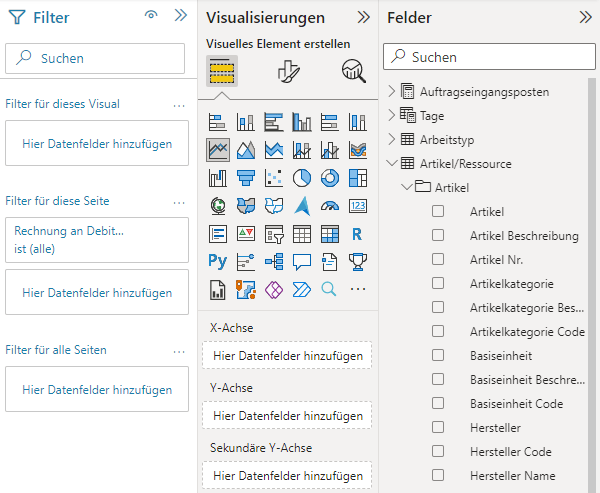
Create interactive reports yourself in no time with the user-friendly drag and drop interface. Leverage hundreds of data visualizations, built-in AI capabilities, and Excel integration to gain new insights about your business and your customers. Simply link different data sources via preconfigured connectors.

Business Intelligence solutions for your industry

When introducing Power BI you don't have to start from scratch. the Power BI- Industry solutions from KUMAVISION contain a large number of reports, evaluations and key figures that are precisely tailored to your industry.
- Ready to use, pre-configured Power BI-Solutions
- Industry, trade, service and health market
- Industry-relevant dashboards, key figures and reports
- Individually expandable, flexibly adaptable
- Continuous development
Power BI provides answers to typical questions such as
- P & L by cost of sales method, broken down by revenue groups
- Freight cost analysis by customer and sales area
- Delivery schedule by period, vendors and article groups
- Dashboard, scorecard, KPI report for revenue metrics, working capital, and cash flow
- DB statistics per recipe with article and resource ID
- Utilization statistics of a resource group (planned vs. actual hours)
- Sales analysis by various segments with sales, costs, sellers
- Contribution margin analyzes by customer groups, regions and articles
- Analysis of production costs for articles and production plants
- Inventory analyzes, Warehouse reaches (actual vs. plan)
For teams
For everywhere
For all
One business intelligence solution, infinite possibilities
ERP system, CRM software, Excel worksheets, Cloud Services, streaming data or local databases: no matter where you keep your data, with Power BI you can network all your different data sources and use them extensively.
brings to it Power BI a large number of preconfigured connectors. Power BI supports both Cloud-Data sources as well as local databases and files. You can easily connect other sources via user-defined connectors.

Business Central

Excel + CSV

Dynamics 365 Sales
Databases

Dynamics 365 Marketing
Cloud Services

dataverse
E-commerce
Do you have any questions or would you like to talk about a project?
The Microsoft Power Platform

Power Automate


